Telegraf
![]()
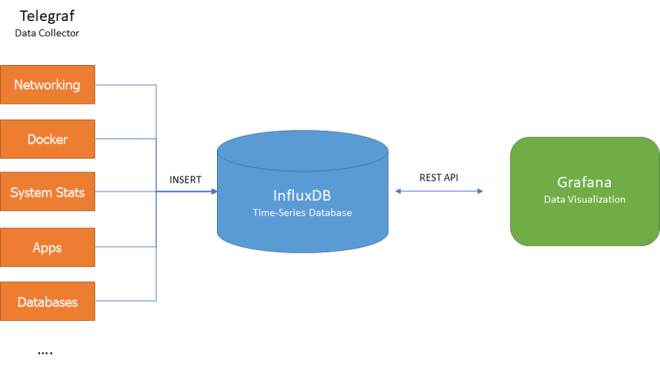
Data collector written in Go for collecting, processing, and aggregating and writting metrics.
Telegraf can collect metrics from a wide array of inputs and write them into a wide array of outputs.
Telegraf’s plugin system allows new inputs and outputs to be easily added, with many integrations to a variety of metrics, events, and logs from popular containers and systems. Pull metrics from third-party APIs, or listen for metrics via a StatsD and Kafka consumer services.
Telegraf also has output plugins to send metrics to a variety of other datastores, services, and message queues, including InfluxDB, Graphite, OpenTSDB, Datadog, Librato, Kafka, MQTT, NSQ, and many others.
Summary:
- Collect metrics from your modern stack of cloud platforms, containers, and orchestrators.
- Connect to datasources like MongoDB, MySQL, Redis, and others to collect and send metrics.
InfluxDB
![]()
InfluxDB is a time series database designed to handle high write and query loads. Scalable time series database for metrics, events and real-time analytics.
InfluxDB is a high-performance data store written specifically for time series data. It allows for high throughput ingest, compression and real-time querying. InfluxDB is written entirely in Go and compiles into a single binary with no external dependencies. It provides write and query capabilities with a command-line interface, a built-in HTTP API, a set of client libraries (e.g., Go, Java, and JavaScript) and plugins for common data formats such as Telegraf, Graphite, Collectd and OpenTSDB.
InfluxDB works with InfluxQL, a SQL-like query language for interacting with data. It has been lovingly crafted to feel familiar to those coming from other SQL or SQL-like environments while also providing features specific to storing and analyzing time series data. InfluxQL supports regular expressions, arithmetic expressions, and time series-specific functions to speed up data processing.
InfluxDB can handle millions of data points per second. Working with that much data over a long period can lead to storage concerns. InfluxDB automatically compacts data to minimize your storage space. In addition, you can easily downsample the data; keeping high-precision raw data for a limited time and storing the lower-precision, summarized data for much longer or until the end of time. InfluxDB has two features that help to automate the downsampling and data expiration processes — Continuous Queries and Retention Policies.
Grafana
![]()
Grafana - An open source, feature rich metrics dashboard, data visualization and exploration tool. It lets you create graphs and dashboards based on data from various data sources (InfluxDB, Prometheus, Elasticsearch, Cloudwatch …)
One of the biggest highlights of Grafana is the ability to bring several data sources together in one dashboard with adding rows that will host individual panels (each with visual type).
Among the other pros are:
- Nice design of the visuals and interface.
- Comfortable to work on several sources.
- Easy to connect to the sources.
However, Grafana also has some cons:
- It takes a bit of time to figure out where filters go and how to compose certain visuals.
- Some of the stuff is abstracted away unnecessarily — there is no way to send raw queries to the data source from Grafana.
- Plugin installation — default install has only a few visual types, and you will most likely end up installing plugins (even for pie chart). Grafana may have few problems during installing plugins, which are not easy to debug.
Prometheus
Prometheus is an open source service monitoring system and time series database.
It spans an entire ecosystem of tools that can bind to it in order to bring some new functionalities.
Prometheus is designed to monitor targets. Servers, databases, standalone virtual machines, pretty much everything can be monitored with Prometheus.
In order to monitor systems, Prometheus will periodically scrape them.
Prometheus expects to retrieve metrics via HTTP calls done to certain endpoints that are defined in Prometheus configuration.
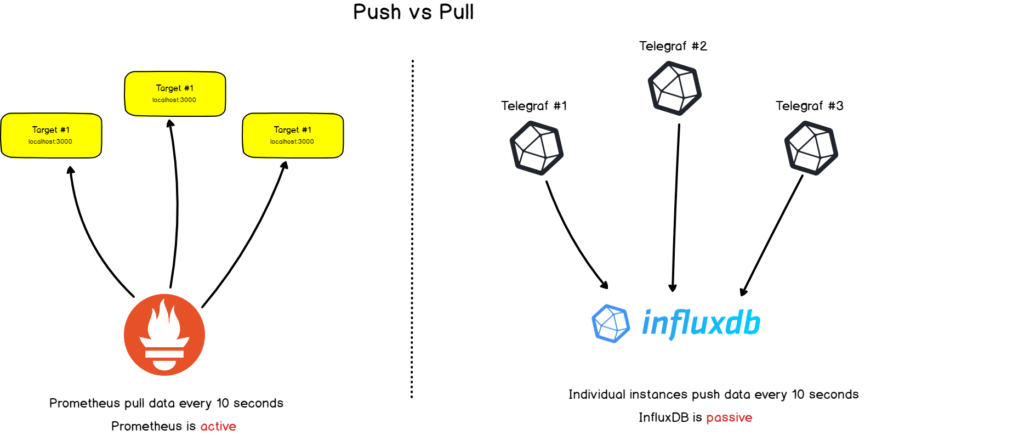
There is a noticeable difference between Prometheus monitoring and other time series databases: Prometheus actively screens targets in order to retrieve metrics from them.
This is very different from InfluxDB for example, where you would essentially push data directly to it.
Prometheus works with key value pairs. The key describes what you are measuring while the value stores the actual measurement value, as a number.
Reminder
Prometheus is not meant to store raw information like plain text as it stores metrics aggregated over time.
The key in this case is called a metric. It could be for example a CPU rate or a memory usage.
Data model
But what if you wanted to give more details about your metric? What if my CPU has four cores and I want to have four separate metrics for them?
This is where the concept of labels come into play. Labels are designed to provide more details to your metrics by appending additional fields to it. You would not simply describe the CPU rate but you would describe the CPU rate for core one located at a certain IP for example.

In action
We can try out Telegraf, InfluxDB and Grafana with these simple steps.
Get the docker-compose for Telegraf, Influxdb and Grafana by pulling:
git clone https://github.com/bcremer/docker-telegraf-influx-grafana-stack
Start up TIG stack by:
cd docker-telegraf-influx-grafana-stack
docker-compose up
To send out some test data
Install php and composer:
# PHP
apt install php7.2-cli

# Composer
php -r "copy('https://getcomposer.org/installer', 'composer-setup.php');"
php composer-setup.php
php -r "unlink('composer-setup.php');"
mv composer.phar /usr/local/bin/composer
Install example-php depedencies and start sending statistics
cd php-example
composer install
php example.php
With your browser go to http://localhost:3000. Login with credentials admin/admin and check out the dashboard. Feel free to play around and make new dashboards and such.
Further reading