Wikipedia
In computing, a log file is a file that records either events that occur in an operating system or other software runs, or messages between different users of a communication software. Logging is the act of keeping a log. In the simplest case, messages are written to a single log file.
A server log is a log file(s) which are automatically created and maintained by the server which host your application or parts of it.
There are different type of log files:
- Access logs (track and record all the requests for individual files that users requested from your Website.
- Error logs (track and record different types of errors)
- Security logs (track and record security related events like: login & logout activities,unauthorized access attempts )
Access and security logs are required to monitor and maintain website security. Error logs are required to troubleshoot and maintain website and server.
When to log
Think of logs as a journal for your program — that should be both readable by humans — and parsable by computers. It contains messages that describe what’s going on, along with the relevant context as key-value pairs. Also, keep in mind that it should be used for data mining purposes. Therefore — include relevant identifiers such as request ID’s, PID’s, user ID’s, etc.
But, why should you have to write a journal, when the program is already defined by its code and inputs? This is a very valid point. Why don’t we always store line-by-line traces of the program’s execution? It’d simply produce too much data — much of which is irrelevant. Logging allows you to chunk the operations of your program — similar to how comments can be used to explain whole sections of code.
Some good places to add log statements are:
- Major branching points in the code: e.g. for a web server, whether it’s a GET or POST request.
- When errors or unexpected values are encountered
- Significant business-specific events: e.g. that someone logged in, or some quota was reached.
- Request failures and retries
- Beginning and end of time-consuming batch operations
TL;DR
Here’s the summarized version:
- Log as if your program was writing a journal of its execution: major branching points, processes starting, etc., errors and other unusual events.
- Structure your logs: Consider a hybrid approach: free text logs, with spliced in JSON or key-value pairs. Don’t invent new data formats.
- Try and avoid multiline logs, since they often get split up on the way to the log collector.
- Never include sensitive user data in your logs, such as passwords or social security numbers.
- Don’t swallow exceptions. Instead make them loud and let the severity of the event dictate the verbosity with which you log it.
- When logging in the critical path, use sampling rather than aggregation.
- Log in English. It is the lingua franca of software.
How to log
How to serialize your data
Let’s consider this example:
INFO pkgs.messaging sendMessage: sent message from jane to joe at time Fri, 20 Apr 2018 09:42: Hey Joe, where you goin’ with that logger of yours?
This is unparsable and will kill the spirits of good people. Why?
- Non-standard date format.
- Unquoted user data — making it inseparable from other meta data in the log.
- There are no obvious key-value handles to use for parsing. You need custom regexes to extract any structured data from it — meaning it will typically not happen.
So, how do you write structured logs?
First, pick a format. Few like XML (said noone), many like JSON. Let's talk about doing structured logging in JSON, but most of the reasoning applies no matter what data format you choose.
JSON logs
As easy as it sounds: “just write JSON logs” — still begs question of How? — one quite naive, yet not uncommon, way of doing it is:
{
    “type”: “INFO”,
    “message”: “INFO pkgs.messaging sendMessage: sent message from jane to joe at time Fri, 20 Apr 2018 09:42: Hey Joe, where you goin’ with that logger of yours?”
}
This unfortunately does not improve much — the only piece of data that’s now in a structured form is the log level. The trick to writing good JSON logs is deciding a level of granularity that satisfies both developer flexibility, and the need for parsability. The other extreme is to make your whole log a properly formatted JSON structure:
{
    “type”: “INFO”,
    “module”: “social”,
    “method”: “sendMessage”,
    “event”: {
        “type”: “sent_successfully”,
        “from”: “jane”,
        “to”: “joe”,
        “message”: “Hey Joe, where you goin' with that logger of yours?”,
        “time”: 1524817341
    }
}
This allows for tools to automatically recognize the different pieces of information in the log as single tokens that can be subject to analysis, or categorization.
Smart log analysis tools, will automatically pick up the key-values and JSON fragments it can find, and add it as metadata to the event, so it can be searched and indexed — which is often enough to properly categorize all events.
Logging in the critical path by sampling
A common reason for not logging is request heavy processes where you couldn’t possibly do a bunch of logging for every request. Here, many just skip logging entirely and instead resort to reporting aggregates — such as periodic check: users_logged_in=10 with mean_session_time=12min. This is sure useful to see the overall health, but it’s meaningless when it comes to spotting bottleneck in individual requests.
A more powerful method is to sample: add log statements to your every request, but only output a X% sample of them. Each log statement could be wrapped in a shouldILog() type of statement that makes it a no-op unless it will be sampled for the particular request. Given enough requests, this will in time be enough to catch at least one instance of almost every single “type” of request — including those hitting tail latencies.
Don’t swallow the red event
“Never swallow exceptions!” — you might have heard this expression before. Again, if there’s one takeaway from this section, it’s that. To illustrate what this means, look at the following:
INFO: everything is fine
FATAL: universe reached heat death, errno=EINTR
INFO: flushed to database n_objects=10 time=30ms
Here, the reader of the logs will be dying to know what happened around second line. It’s apparent that something very serious happened, but nothing more is provided. This often happens through catch-all clause, that is followed by a log, and sometimes by a process.exit(), or worse, just that one thread crashing...
Whenever you encounter an exception you should try and report everything of and around it. Often, the best thing to do is to just not handle it and let it rise to the top: panic, rethrow or whatever applies to your language. The default behavior of the language is usually to be very verbose about what happened. It’s more often when someone tries to capture it in order to rephrase it, that information is lost and turns into shit’s broken, exiting.
Exceptional events should have exceptional consequences. If your program reaches a fatal state, you should provide more context to it, than you would for a more business-as-usual type of event.
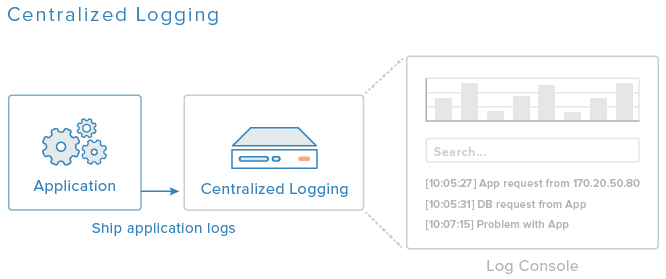
Centralized logging
Consider your environment has a number of servers. Whenever there is an issue being reported, you have to manually log into each server and check logs to troubleshoot it. Searching for a particular error across hundreds of log files on hundreds of servers becomes a pain if the environment grows bigger. Moreover, there is no way to alert if there is any occurrence of error / abnormal activity in the log files unless the issue is being reported by the application team or after the service becomes unavailable.
Centralized log management is a system that aggregates logs from all servers, applications, and networking devices into a single location. This centralized location allows for a single point of entry for easy access, control, storage, and analysis, streamlining the logging process and allowing for a complete overview of your environment. Without a centralized server or a proper log aggregator, it becomes quickly unsustainable to log into each server individually, review logs, and perform grep searches on them, especially when it comes to time sensitive problems like crashed servers or security threats. Modernized log management solutions that auto-collect, parse data, centralize, and manage logs will provide a unified view of what’s going on across all network elements, across all locations.
A logging service for centralized logging. This can be the Elastic Stack, Slack, Graylog, and others. You want a logging stack that includes a strong parser/visualizer because you are going to be dealing with a bunch of data. Part of your infrastructure can be one of these services, and a guarantee that each host in the environment will be configured to transfer log files on behalf of each service.
Log Collection
Since logs are found anywhere on your software stack, operating system, containers, cloud servers and infrastructure, there are various strategies used to collect each stream of log data. Developers can choose to add logging code libraries or directly send it to an ingestion service through a REST API. Collector agents can be installed on the OS and platform level to stream directories with log files. Logs can also be collected centrally from rsyslog, syslog, AWS, JavaScript, JSON, Kubernetes, Docker, Heroku.
Log Ingestion
Log ingestion is the process of collecting, formatting, and importing logs from external sources like applications, servers, and platforms. To utilize this data in an insightful way, logs should be formatted properly to include timestamps, input type classification, files and directories, network events, sources, and any other information your organization needs to easily find and understand this data in the future. An efficient log management solution has a robust ingestor service, automatically collecting data without dropping log lines. It should also keep up with large volumes and spikes, which inevitably happen when production issues arise.
Log Aggregation
A truly centralized log management system will automatically aggregate logs from different sources and various formats in a way that team members search, analyze, visualize log data. The log lines need to be displayed in order and no lines should be missing so that a user can jump to specific moments in time to see log details from all sources and servers. An effective centralized log management tool will have fast live tail, so you can see the log lines in real-time as they are collected. The ability to efficiently index the logs at this point in the process will result in faster search results.
Log Analysis
Log analysis plays a large part in any successful logging system, and will include various features to streamline logging processes, provide value, and actionable insights across all activity. Custom log parsing, log visualization, smart alerting with context, and even role-based access controls are some of the features the right log analyzer should encompass, so the right personnel sees the logs that pertain to them.
Further reading