ELK
ELK stands for Elasticsearch, Logstash and Kibana. The trio, which was once separate, joined together to give users the ability to run log analysis on top of open sourced software that everyone can run for free.
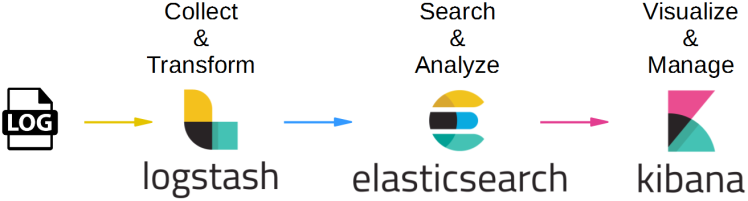
- Elasticsearch is the search and analysis system. It is the place where your data is finally stored, from where it is fetched, and is responsible for providing all the search and analysis results.
- Logstash, which is in the front, is responsible for giving structure to your data (like parsing unstructured logs) and sending it to Elasticsearch.
- Kibana allows you to build pretty graphs and dashboards to help understand the data so you don’t have to work with the raw data Elasticsearch returns.
Together, these different components are most commonly used for monitoring, troubleshooting and securing IT environments.
The ELK Stack is popular because it fulfills a need in the log management and analytics space. Monitoring modern applications and the IT infrastructure they are deployed on requires a log management and analytics solution that enables engineers to overcome the challenge of monitoring what are highly distributed, dynamic and noisy environments.
The ELK Stack helps by providing users with a powerful platform that collects and processes data from multiple data sources, stores that data in one centralized data store that can scale as data grows, and that provides a set of tools to analyze the data.
Graylog

Graylog is defined in terms of log management platform for collecting, indexing, and analyzing both structured and unstructured data from almost any source.
To deploy Graylog, you need to run Elasticsearch along with MongoDB, but the question is, why both of them.
The reason behind this requirement is as follow:
-
Graylog uses MongoDB to store your configuration data, not your log data. Only metadata is stored, such as user information or stream configuration
-
Graylog uses Elasticsearch to store the logged data, as we know Elasticsearch is a powerful search engine . It is recommended to use a dedicated Elasticsearch cluster for your Graylog setup.
Keep in mind that messages are only stored in Elasticsearch. If you have data loss on Elasticsearch, the messages are gone — except if you have created backups of the indices.
It has a friendly GUI and supports a wide range of data formats. Provides you with good options to control authentication and user permissions. You can also configure it to receive alerts via emails. Finally, Graylog uses good-ol REST API.
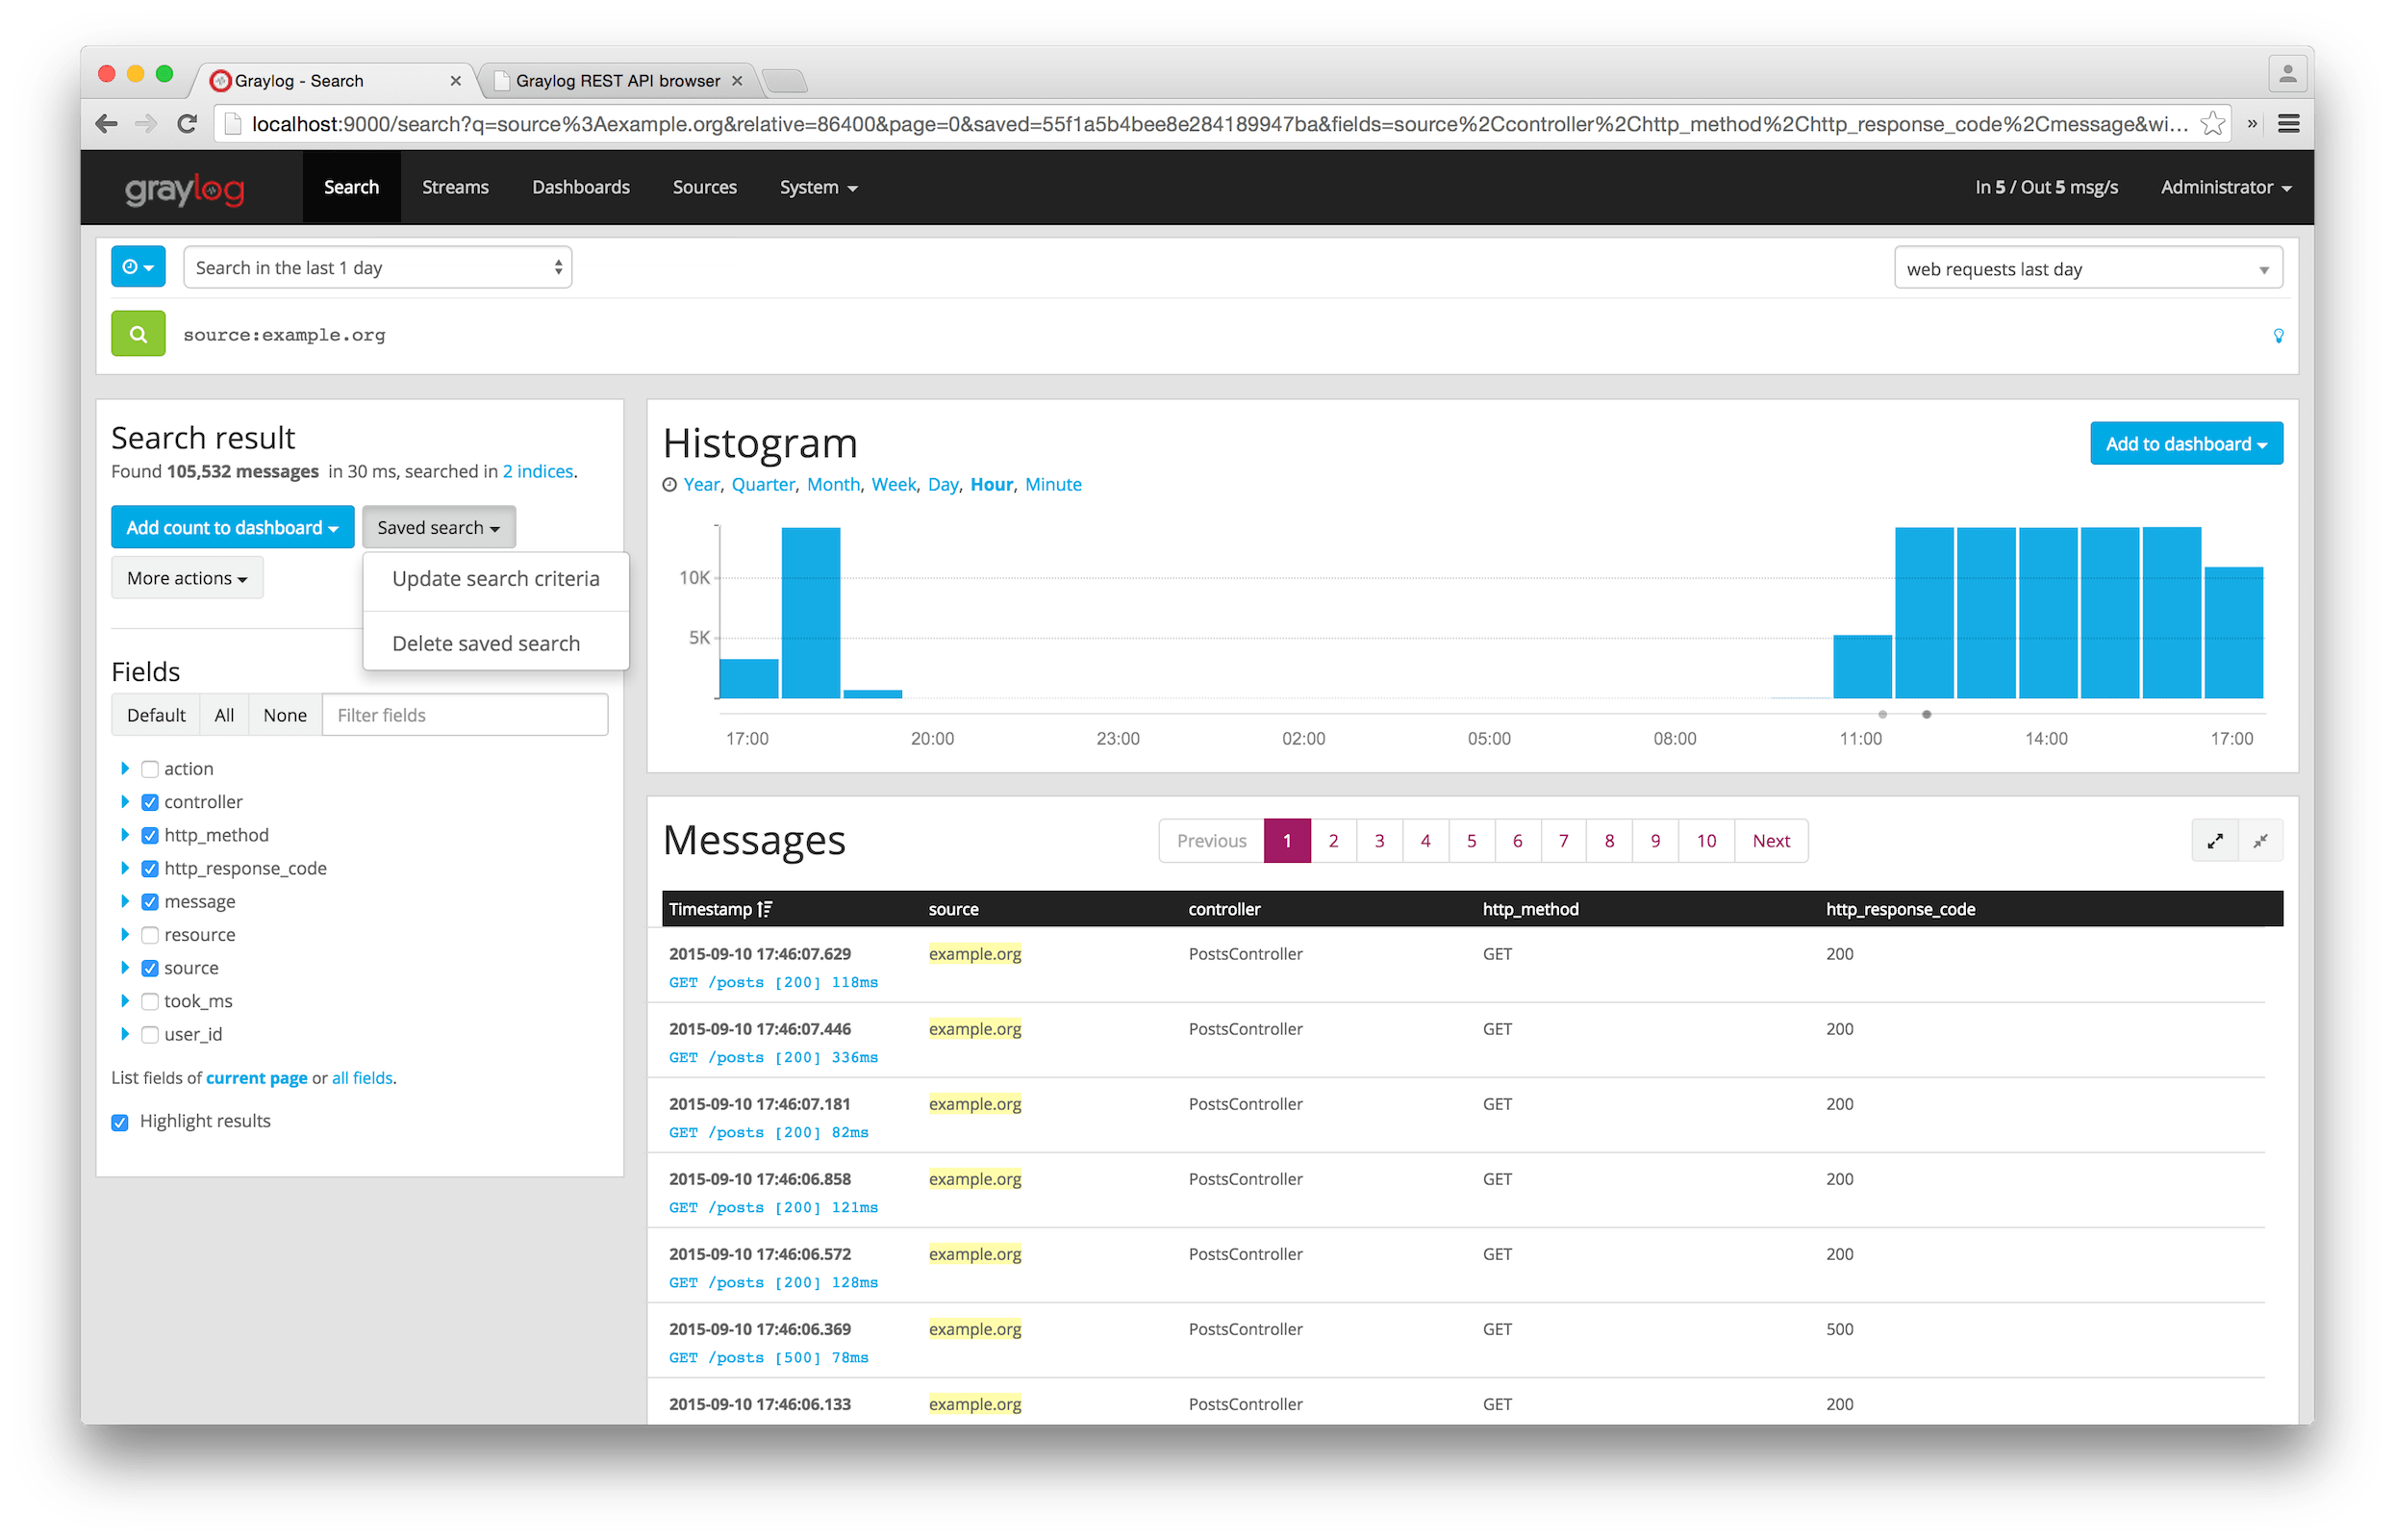
Configuration and Inputs
Once you’ve everything up and running, open your browser and log into Graylog. The default entry page greets you with additional tips and tricks. Graylog is all about usability – you are advised to create inputs to send in data from remote. Everything can be configured via the web interface, or the REST API. Some more advanced settings are only available via the REST API.
If you need more input plugins, you can search the marketplace and install the required one. Or you’ll create your own. By default Graylog supports GELF, Beats, Syslog, Kafka, AMQP, HTTP.
Streams and Alerts
Incoming messages can be routed into so-called “streams”. You can inspect an existing message and create a rule set based on these details. That way you can for example route your application notification events into Graylog and correlate events in defined streams.
Alerts can be defined based on existing streams. The idea is to check for a specific message count and apply threshold rules. Alerts can also be reset after a defined grace period. If you dig deeper, you’ll also recognise the alert notifications which could be Email or HTTP.
Dashboards
You can add stream message counters, histograms and more to your own dashboards. Refresh settings and fullscreen mode are available too. You can export and share these dashboards. If you are looking for automated deployments, those dashboards can be imported via the REST API too.
Graylog vs ELK
Graylog server (the entire application and web interface), combined with MongoDB and Elasticsearch, is often compared to the ELK stack (Elasticsearch, Logstash, and Kibana). Though both solutions are pretty similar in terms of features set, there are a few differences to consider.
The most important distinction between the two lies in the fact that, from the very beginning, Graylog is positioned as a powerful logging solution, while ELK is a Big Data solution. Graylog can receive structured logs and standard syslog directly from an application through the network protocol. On the contrary, ELK is the solution that analyzes already collected plain text logs using Logstash and then parses and passes them to ElasticSearch.
In ELK, Kibana plays the role of a dashboard and displays the data received from Logstash. Graylog in this sense is more convenient as it offers a single-application solution (excluding ElasticSearch as a flexible data storage) with almost the same functionality. So the time needed to deploy a usable solution is smaller. Moreover, Graylog has a friendlier GUI right out of the box and superior permissions system compared to ELK.
Further reading